
Corporate bonds are a secure means to raise working capital for business expansion.
Preferred Stock Investment Guide

The preferred stockholder invests in the stock for the fixed income the preferred shares generate through semiannual dividends.
Why Invest In Common Stock?

At its core, investing in common stock centers around the potential to realize capital appreciation.
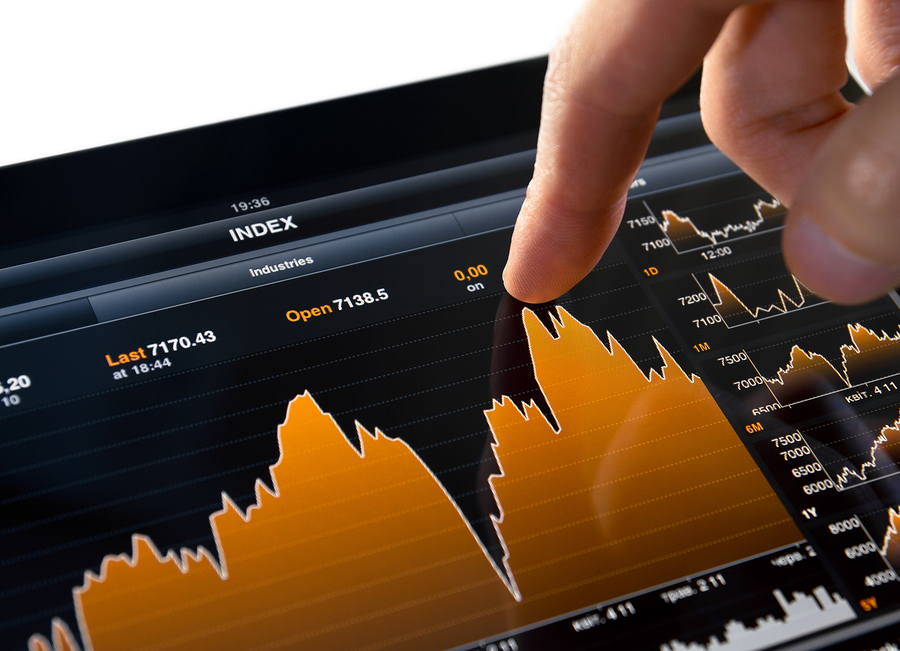
Stock Market Forecasting Tips For Investors

The strategic game of stock market forecasting resonates with the complex nature of investing, where the best move is not always the most obvious.
Top 5 Stock Market Indicators

The whole is always more than the sum of its parts; therefore, knowing how everything fits together is the key to understanding the stock market.
How To Navigate The Stock Market

Remember, money isn’t everything… But understanding the stock market can help you make the most of what you have.
Investing In Stocks: “The Rule of Three”

Essential guide to help investors know when to buy stocks or enter the stock market…
Stock Market Secrets: Revealed!
Money makes the world go round, but despite all its attention, only some people realize its impact on the economy. It’s A Fact: Money Supply Is Very Important To Watch Even Wall Street veterans have … Read More
Treasury Bonds Vs. Corporate Bonds

In today’s article, we will discuss the ratio of AAA bond yields to Treasury bill yields.
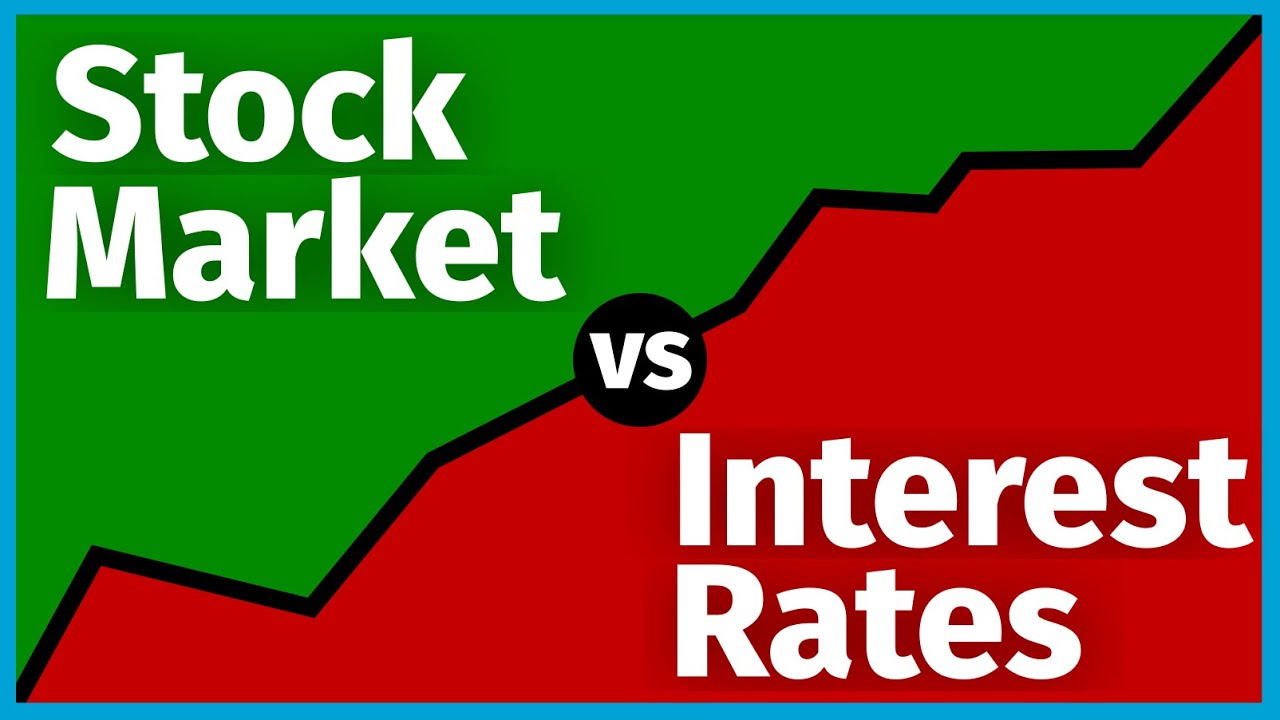
Understanding Interest Rates: Fact And Fiction
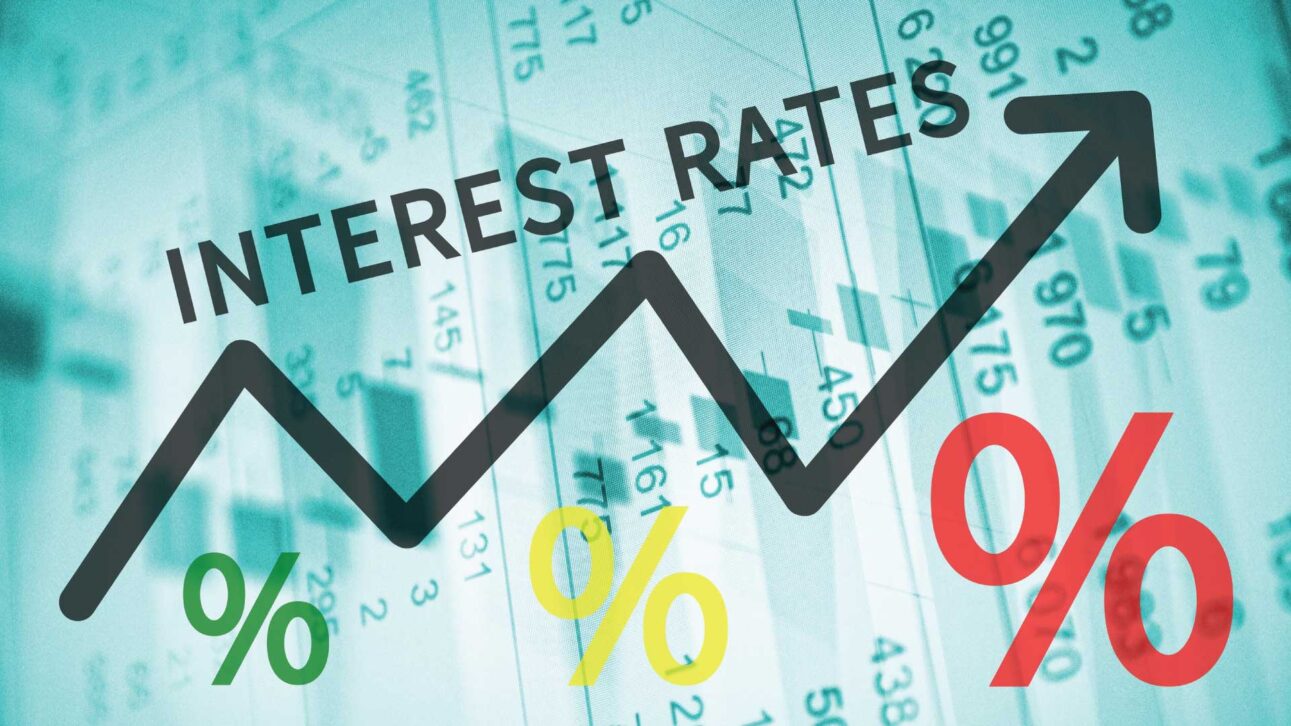
When interest rates rise, bond prices fall because investors aren’t willing to pay as much for a bond that will pay them less than current interest rates.
Fine-Tuning Your Investing Skills

Stocks will almost always outperform other investments whenever unemployment insurance claims have increased 15% or more from the prior year.
When To Dump Stocks Before They Hit The Skids

Understanding the stock market’s fluctuations is crucial. By following its cues, you can strategically know when to dump stocks before they decline and reenter the market when there’s potential for growth, thereby making informed investment decisions.
What Is The Best Stock Market Forecaster?

The best stock market forecaster for the next twelve months…

Easy Guide For Investing In Small Stocks

There are two main strategies for investing in small stocks…
Discover One Simple Investing Rule

Navigating The Stock Market’s Volatility Will Depend On Following One Simple Investing Rule…
Investor’s Guide: How To Invest In Bonds

Want to strengthen your portfolio’s risk-return profile? This comprehensive guide on how to invest in bonds can create a more balanced portfolio by adding diversification and calming volatility.
Advantages of Investing In Exchange-Traded Funds ETFs

In the vast landscape of investment opportunities, investing in exchange-traded funds (ETFs) have emerged as a popular and versatile choice for both novice and seasoned investors.

- Page 1 of 2
- 1
- 2
